 Upinder S. Bhalla, Ph.D.
Professor & Dean, NCBS, Bengaluru, India
Watching the network change during the formation of associative memory
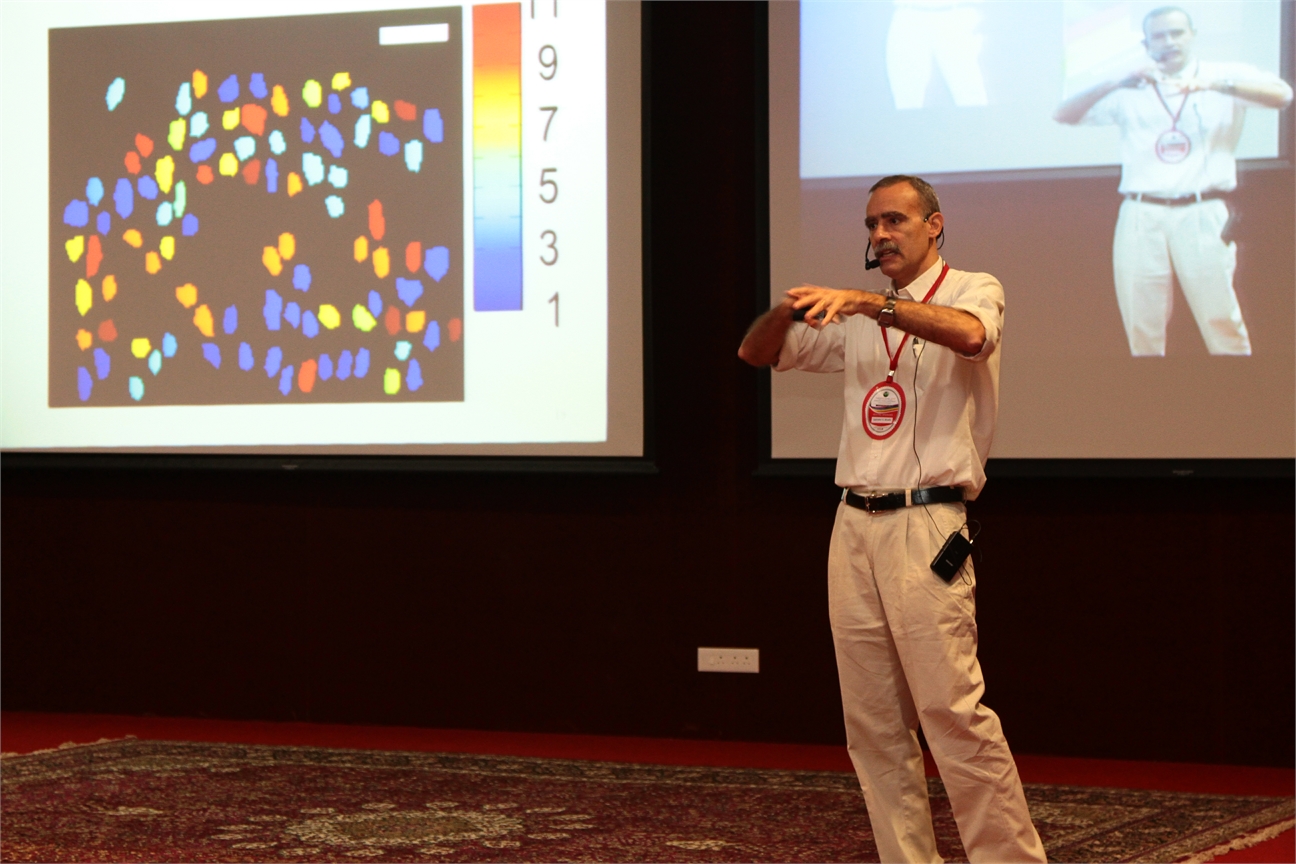
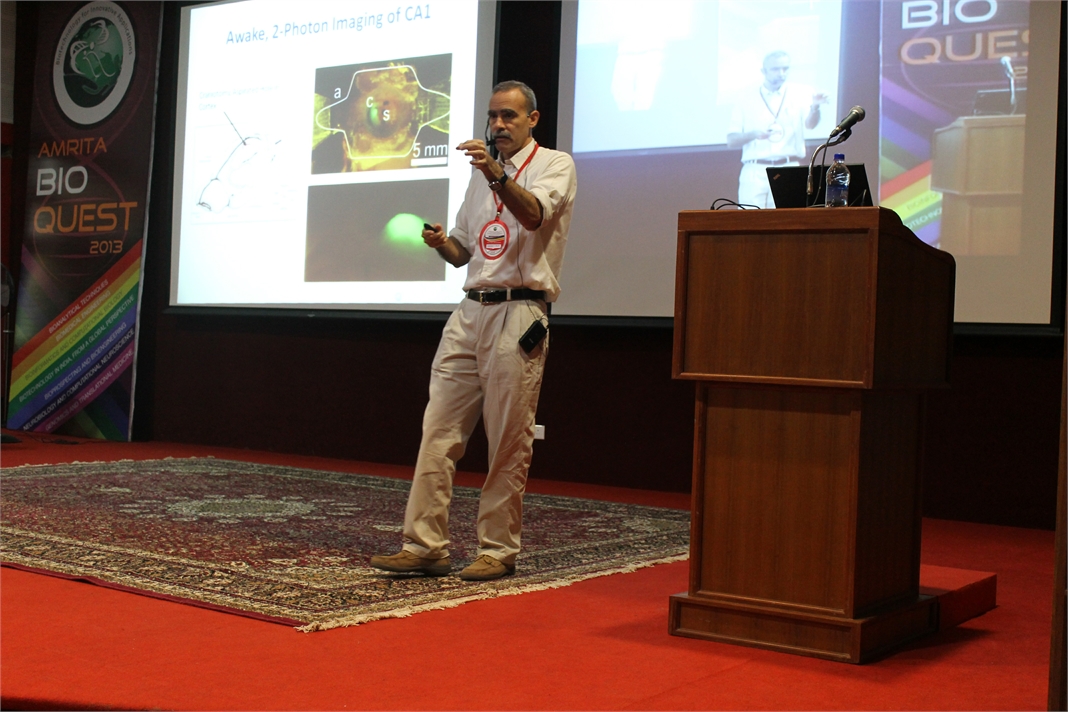
The process of learning is measured through behavioural changes, but it is of enormous interest to understand its cellular and network basis. We used 2-photon imaging of hippocampal CA1 pyramidal neuron activity in mice to monitor such changes during the acquisition of a trace conditioning task. One of the questions in such learning is how the network retains a trace of a brief conditioned stimulus (a sound), until the arrival of a delayed unconditioned stimulus (a puff of air to the eye). During learning, the mice learn to blink when the tone is presented, well before the arrival of the air puff.
The mice learnt this task in 20-50 trials. We observed that in this time-frame the cells in the network changed the time of their peak activity, such that their firing times tiled the interval between sound and air puff. Thus the cells seem to form a relay of activity. We also observed an evolution in functional connectivity in the network, as measured by groupings of correlated cells. These groupings were stable till the learning protocol commenced, and then changed. Thus we have been able to observe two aspects of network learning: changes in activity (relay firing), and changes in connectivity (correlation groups).
 Claudia AM Wheeler-Kingshott, Ph.D.
University Reader in Magnetic Resonance Physics, Department of Neuroinflammation, UCL Institute of Neurology, London, UK
Abstract
Detecting neuronal activity in vivo non-invasively is possible with a number of techniques. Amongst these, in 1990 functional magnetic resonance imaging (fMRI) was proposed as a technique that has a great ability to spatially map brain activity by exploiting the blood oxygenation level dependent (BOLD) contrast mechanism [1, 2]. In fact, neuronal activation triggers a demand for oxygen and induces a localised increase in blood flow and blood volume, which actually exceeds the metabolic needs. This in turns causes an increase of oxyhaemoglobin in the venous compartment, which is a transient phenomenon and is accompanied by a transient change (decrease) in the concentration of deoxyhaemoglobin. Due to its paramagnetic properties, the amount of deoxyhaemoglobin present in the venous blood affects the local magnetic field seen by the spins (protons) and determines the local properties of the MR signal. A decrease in deoxyhaemoglobin during neuronal activity, therefore, induces local variations of this magnetic field that increases the average transverse relaxation time of tissue, measured via the T2* parameter [3]. This means that there is an increase of the MR signal (of the order of a few %, typically <5%) linked to metabolic changes happening during brain function. Activation can be inferred at different brain locations by performing tasks while acquiring the MR signal and comparing periods of rest to periods of activity.
The macroscopic changes of the BOLD signal are well characterised, while the reason for the increased blood supply, exceeding demands, needs further thoughts. Here we will discuss two approaches for explaining the BOLD phenomenon, one that links it to adenosine triphosphate production [4] and enzyme saturation, the other that relates it to the very slow diffusion of oxygen through the blood-brain-barrier with a consequent compensatory high demand of oxygen [5]. Some evidence of restricted oxygen diffusion has been shown by means of hypercapnia [6], although it is not excluded that both mechanisms may be present.
Overall, the BOLD signal changes theory and its physiological basis will be presented and discussed.
References
- Ogawa, S., et al., Brain magnetic resonance imaging with contrast dependent on blood oxygenation. Proc Natl Acad Sci U S A, 1990. 87(24): p. 9868-72.
- Kwong, K.K., et al., Dynamic magnetic resonance imaging of human brain activity during primary sensory stimulation. Proc Natl Acad Sci U S A, 1992. 89(12): p. 5675-9.
- Bandettini PA, et al. Spin-echo and gradient-echo EPI of human brain activation using BOLD contrast: a comparative study at 1.5 T. NMR Biomed. 1994 Mar;7(1-2):12-20
- Fox, P.T., et al., Nonoxidative glucose consumption during focal physiologic neural activity. Science, 1988. 241(4864): p. 462-4.
- Gjedde, A., et al. Reduction of functional capillary density in human brain after stroke. J Cereb Blood Flow Metab, 1990. 10(3): p. 317-26.
- Hoge, R.D., et al., Linear coupling between cerebral blood flow and oxygen consumption in activated human cortex. Proc Natl Acad Sci U S A, 1999. 96(16): p. 9403-8.
 Rajgopal Srinivasan, Ph.D.
Principal Scientist & Head Bio IT R&D, TCS Innovation Labs, India
Interpretation of Genomic Variation – Identifying Rare Variations Leading to Disease
Genome sequencing technologies are generating an abundance of data on human genetic variations. A big challenge lies in interpreting the functional relevance of such variations, especially in clinical settings. A first step in understanding the clinical relevance of genetic variations is to annotate the variants for region of occurrence, degree of conservation both within and across species, pattern of variation across related individuals, novelty of the variation and know effects of related variations. Several tools already exist for this purpose. However, these tools have their strengths and weaknesses. A second issue is the development of algorithms, which, given a rich annotation of variants are able to prioritize the variants as being relevant to the phenotype under investigation.
In my talk I will detail work that has been done in our labs to address both of the above problems. I will also illustrate the application of these tools that helped identify a rare mutation in the ATM gene leading to a diagnosis of AT in two infants.

Pandiaraj Manickam, Niroj Kumar Sethy, Kalpana Bhargava, Vepa Kameswararao and Karunakaran Chandran
Designing electrochemical label free immunosensors for cytochrome c using nanocomposites functionalized screen printed electrodes
Release of cytochrome c (cyt c) from mitochondria into cytosol is a hallmark of apoptosis, used as a biomarker of mitochondrial dependent pathway of cell death (Kluck et al. 1997; Green et al. 1998). We have previously reported cytochrome c reductase (CcR) based biosensors for the measurement of mitochondrial cyt c release (Pandiaraj et al. 2013). Here, we describe the development of novel label-free, immunosensor for cyt c utilizing its specific monoclonal antibody. Two types of nanocomposite modified immunosensing platforms were used for the immobilization of anti-cyt c; (i) Self-assembled monolayer (SAM) functionalized gold nanoparticles (GNP) in conducting polypyrrole (PPy) modified screen printed electrodes (SPE) (ii) Carbon nanotubes (CNT) incorporated PPy on SPE. The nanotopologies of the modified electrodes were confirmed by scanning electron microscopy (SEM). Cyclic voltammetry, electrochemical impedance spectroscopy (EIS) were used for probing the electrochemical properties of the nanocomposite modified electrodes. Method for cyt c quantification is based on the direct electron transfer between Fe3+/Fe2+-heme of cyt c selectively bound to anti-cyt c modified electrode. The Faradaic current response of these nanoimmunosensor increases with increase in cyt c concentration. The procedure for cyt c detection was also optimized (pH, incubation times, and characteristics of electrodes) to improve the analytical characteristics of immunosensors. The analytical performance of anti-cyt c biofunctionalized GNP-PPy nanocomposite platform (detection limit 0.5 nM; linear range: 0.5 nM–2 μM) was better than the CNT-PPy (detection limit 2 nM; linear range: 2 nM-500nM). The detection limits were well below the normal physiological concentration range (Karunakaran et al. 2008). The proposed method does not require any signal amplification or labeled secondary antibodies contrast to widespread ELISA and Western blot. The immunosensors results in simple and rapid measurement of cyt c and has great potential to become an inexpensive and portable device for conventional clinical immunoassays.